
- The 66-month Palermo BAT Catalogue (products available)
- The 100-month Palermo BAT Catalogue (products available on request)
- V404 Cyg: the 2015 June outburst observed by BAT
Surveys in the hard X-ray domain
Imaging techniques based on focusing the X-ray radiation by grazing reflection from mirrors becomes ineffective above ~10 keV due to technological constraints. At higher energies, coded mask tecniques are an efficient alternative method, that allows for medium resolution (arcmin) imaging. After the first hard X-ray surveys, performed with detectors equipped with collimator-limited field of view (UHURU, 2-20 keV and HEAO1, 0.2 keV – 10 MeV), several space observatories have been equipped with coded mask telescopes: Spacelab/XRT, MIR/KVANT/TTM, ART-P and SIGMA onboard GRANAT and BeppoSAX/WFC. Coded mask imagers are now working onboard INTEGRAL (the IBIS-ISGRI telescope), Swift (the Burst Alert Telescope, BAT), and AGILE (Super-AGILE).
In such telescopes, the radiation coming from the sky sources is spatially modulated by a mask consisting of an array of opaque and transparent elements and recorded by a position sensitive detector. In order to avoid ambiguities in the reconstruction of the sky image, the mask pattern is designed in such a way that the radiation from each sky direction casts a unique shadow on the detector. In contrast to focusing imaging systems, where source photons are concentrated on a small detector area, in a coded mask instrument the photons emitted from a cosmic source are spread over the whole detector area and the recorded shadowgram is the additive contribution from all the sources inside the field of view (FOV) and of the instrumental background. By knowing the orientation of the satellite in space and by analyzing the data from the detector it is possible, through image reconstruction algorithms, to evaluate the position and the intensity of all cosmic sources and of the background level, thus reproducing the image of the observed sky. Several algorithms are used to reconstruct the sky observed with coded mask instruments. The most widely used method for image reconstruction is the cross-correlation of the recorded data pattern with the mask pattern.
The BAT telescope
The Burst Alert Telescope (BAT) on board the Swift observatory, with its large field of view (1.4 steradian half coded) and large detector area (a factor 2 greater than ISGRI) offers the opportunity for a large increase of the sample of objects that contribute to the luminosity of the sky in the hard X-rays allowing for a substantial improvement of our knowledge of the AGN and of the cosmic hard X-ray background.
The BAT is a coded-mask detector sensitive in the 15-150 keV band used as a GRB detector on board Swift}. While waiting for new GRBs, it continuously collects spectral and imaging information in hard X-rays and accumulates data in survey mode covering a fraction between 50 and 80% of the sky every day. Data are immediately made available to the scientific community in the public Swift data archive (Swift Quick-Look Data), together with all houskeeping and spacecraft attitude information. The Swift-BAT entrance window is a 2.7 m2 coded-aperture mask of 5×5 mm2 elements placed 1 m above the detector plane, with an on-axis point spread function (PSF) of 22 arcmin FWHM. The mask is designed with a pseudo-random pattern that has the advantage (with respect to cyclic patterns like e.g. the one used for ISGRI) of being quite insensitive to the possible turning off of a limited number of detector elements and to the presence of detector gaps; moreover the reconstructed images do not suffer from the presence of ghost sources caused by the periodic design of the cyclic pattern. On the other hand, it is characterized by a PSF with an extended plateau that spans over the whole image and induces cross-contaminations among sources in the same FOV. The BAT detector plane consists of 5200 cm2 array of 32,768 4×4 mm2 CdZnTe elements organized in 128 elements sub-arrays (modules) separated by thin gaps and mounted in 16 mechanical structures (blocks).
The BAT survey data are collected in the form of Detector Plane Histograms (DPH). A DPH consists of a three-dimensional array where an 80 channel spectrum is accumulated for each detector pixel over the integration period. Typical DPH integration time is five minutes, but longer integration times are sometimes found (e.g. when telemetry reduction is needed) as well as shorter integration times since survey mode is always interrupted when the spacecraft begins a slew to a new target or when entering the South Atlantic Anomaly (SAA).
The Palermo BAT survey project
In order to expoit the BAT survey archive, a dedicated software, the BatImager, was developed.
The Bat_imager code
The BatImager integrates each single DPH in a selected energy range, producing the corresponding detector plane iimage (DPI). A preliminary cleaning of the disabled and noisy pixels is performed, and the DPI is cross correlated with the mask pattern, in order to identify and subtract bright sources (with S/N >8). Then the background is modelled on a large scale and subtracted. A further search for bad pixels is performed, obtainining the final map of all pixels to be excluded in the following steps. A further correction is applied to take into account differences in the detection efficiency of single detector pixels, through a time/energy dependent efficiency map, built stacking all the processed DPI and equalizing the average residual contribution for each pixel. The original DPI, corrected for the efficiency map and cleaned for the bad pixels, is processed again, with all the contributions from the background and the bright sources identified in the previous steps computed simultaneously, in order to correct for cross-contamination effects. These contributions are subtracted from the DPI, that is then converted into a sky image, using the Healpix projection. This projection provides an equal-area pixelization on a sphere and allows for the generation of an all-sky map, avoiding the distortion introduced by other types of sky projections far from the projection center. This sky map is then corrected for the occultation of Sun, Earth and Moon. The sky maps produced from each DPI are added together, with the intensity in a given sky direction computed from the contribution from all the sky images, each inversely weighted for its variance in that direction. As described above, the bright sources and background were already subtracted from each single DPI, therefore this all-sky mosaic contains only the residual sky contribution. In order to correct for residual systematic effects (e.g. imperfect modelling of the source illumination pattern or of the background distribution), the all-sky S/N map is sampled on a scale significantly larger than the PSF: the local average S/N is subtracted and its measured variance used to normalize the local S/N distribution. Finally, we obtain a S/N map with zero average unitary and variance that can be used for a blind source detection. Click here for a block diagram of the BatImager.
The Palermo BAT catalogue
We have performed a complete analysis of 39 months of BAT survey data in the 14-30, 14-70, 14-150 keV bands (Cusumano et al. 2008, A&A submitted). The data sample we used covers 90% of the sky down to a flux limit of 1.1 mCrab in the 14-150 keV band and 50% of the sky down to a flux limit of 0.8 mCrab. The minimum detection limiting flux is not fully uniform on the sky: the Galactic center and the ecliptic plane are characterized by a worse sensitivity due to high contamination from intense Galactic sources and to the observing constrains of the Swift spacecraft. The highest flux sensitivity is achieved near the ecliptic poles where a detection flux limit of about 1.1E-11 erg is reached (~0.5 mCrab).
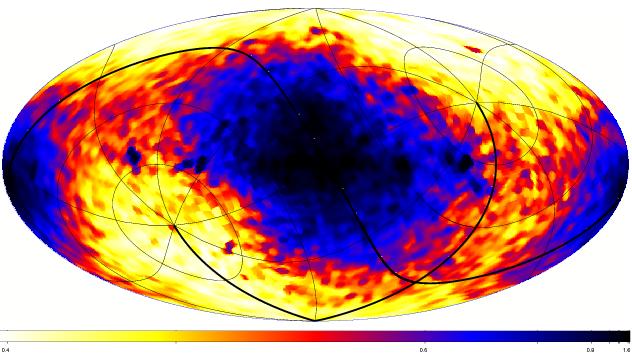
The scale on the colorbar is in mCrab.
Our search yielded a list of 970 detections above a significance threshold of 4.8 standard deviations. We proceeded to the identification of the source counterparts using three strategies: cross-correlation with published hard X-ray catalogues, analysis of field observations of soft X-ray instruments, cross-correlation with the Simbad databases. Our all-sky map is shown in in the Figure below. We derived a catalogue of 748 identified sources, 65% of which are extragalactic, while 25% are Galactic objects and 10% are already known X-ray or gamma ray emitters whose nature has not yet been determined. Our catalogue is by far more extended than the third ISGRI catalogue (amounting to ~500 sources, including transients; Bird et al. 2007) and the latest BAT survey catalogue published by the Swift-BAT team (154 AGNs from 9 months of data only; Tueller et al. 2008).
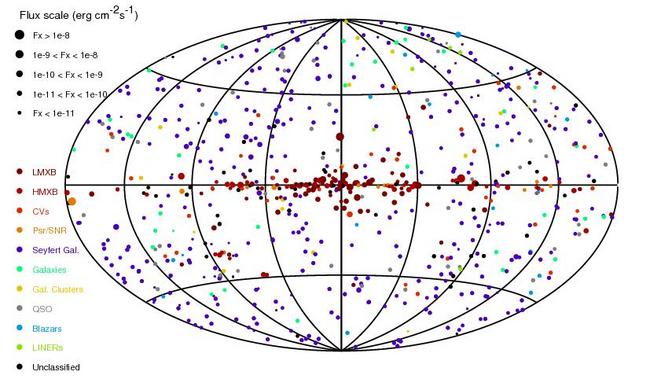
The size of the symbol is proportional to the source flux in the 14-150 keV band.
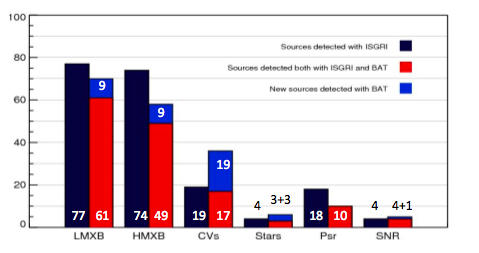
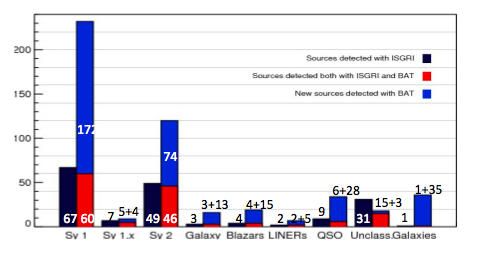
By comparing the BAT source distribution with the third ISGRI catalogue we find a significant increase in the number of detected cataclysmic variable, and a dramatic improvement in the detection of extragalactic objects, both in the nearby Universe (normal galaxies, LINERs) and at higher distances (Seyfert galaxies, QSO, clusters of galaxies). This can be explained in part with the different pointing strategy of the two instruments. Sources in the Galactic plane not included in the ISGRI catalogue have been also detect. most of which identified as X-ray binaries.
The Palermo BAT survey catalogue is available here.
The remaining 220 unidentified sources detected with the BatImager in the 39-months all-sky map are uniformly distributed in the sky. From careful analysis of noise statistical fluctuations we expect between 23 and 69 spurious detections, corresponding to a fraction ranging from 10 to 30% of the sample of the 220 unidentified sources. We have started an identification campaign of these source candidates with Swift-XRT (GI Cycle 5)
Useful links
Swift BAT 105-Month Hard X-ray Survey
ASDC Multi-Mission Interactive Archive
INTEGRAL General Reference Catalogue